


Part 1: Charts — Visualizing Numbers
Create a chart in 30 seconds
- On any page, type
/chart— or click+next to an existing database's view names and pick Chart. - Choose the type: vertical bar, horizontal bar, line, donut, or number.
- Link an existing database (or create one on the spot).
- Open the settings menu (top right) and configure the X axis (which property, sort order, hide groups) and Y axis (count, sum, group-by, cumulative toggle).
What to know before you rely on them
- Pricing: the Free plan includes one chart to try; unlimited charts need any paid plan.
- Scale limits: up to 200 groups and 50 subgroups per chart — long time-series get truncated.
- Read-only: you can't edit database entries from a chart view — keep a table view alongside.
- Axis restrictions: rollups, buttons, files, and some formulas can't be plotted.
For flowcharts and diagrams (rather than data charts), a Mermaid code block covers most needs — we walk through it in the Notion mind map guide.
Part 2: The Other Graph — Visualizing Connections
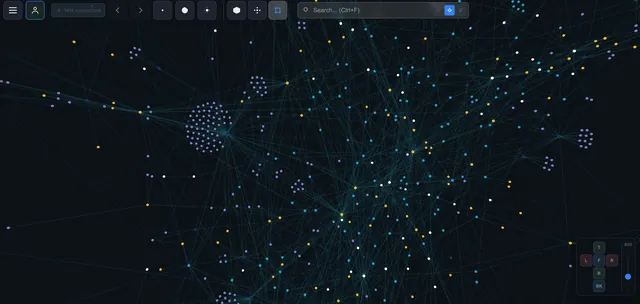
The second meaning has nothing to do with numbers: a graph as a network — pages as nodes, links as edges, the way Obsidian users mean it. Notion collects all the raw material for this constantly (every @-mention creates a backlink, every database relation is a typed edge, every sub-page is a branch) — but as we covered in Does Notion Have a Graph View?, it has no way to draw any of it.
Build it in three steps
- Create the edges — link pages with @-mentions as you write; connect databases with relations where structure matters. No special discipline needed; normal Notion usage builds the network.
- Connect IVGraph — sign in with Notion; the sync reads pages, databases, backlinks, mentions, and relations through the official API (about 5 minutes for ~2,000 pages).
- Explore — the workspace renders as an interactive 3D graph: clusters show your real topics, hub pages stand out by size, orphaned pages float free. Search, filter, and click through to any page.
Which One Do You Actually Need?
| You want to see… | Use | Where |
|---|---|---|
| Tasks by status, sales over time, budget split | Chart view | Native (/chart) |
| A process or hierarchy diagram | Mermaid code block | Native (code block) |
| How your pages, ideas, and projects connect | Knowledge graph | IVGraph (via API) |
FAQ
How do I add a graph to a Notion page?
For a data chart: /chart, pick a type, link a database. For a diagram: Mermaid code block. For a network of your pages: connect IVGraph.
Can you make a line graph in Notion for free?
Yes — one chart is included on the Free plan; more require a paid plan.
Why can't my chart use a rollup as an axis?
Chart axes don't support rollups, buttons, unique IDs, files, or formulas that output lists — plot the underlying property instead, or add a simpler helper property.
How do I get an Obsidian-style graph of my Notion?
That's the connections graph from Part 2: build links normally, connect IVGraph, and the workspace renders as an interactive 3D network — free up to 500 nodes.