 IVGraph
To open Obsidian’s graph view, click Open graph view in the Ribbon; for the active note’s neighborhood, use the Open local graph command. Start with the local graph when working on a note, and use the global graph to inspect the broader vault. The useful part is not the shape of the picture—it is finding a connection, a neglected note or a linking problem you can act on.
Open the Graph and Read the Basics
Graph view is a built-in core plugin. As Obsidian’s documentation explains, circles represent notes and lines represent internal links. More nodes referencing a note make its circle bigger.
For example, write [[Caching]] inside a note about API performance to link those notes. The graph represents that explicit connection; it does not need to infer that the subjects are related.
- Hover over a circle to highlight that note’s connections.
- Click a note to open it, or right-click for its available actions.
- Zoom with the mouse wheel or the
+and-keys. - Move around by dragging the graph or using the arrow keys. Hold Shift to speed up keyboard movement.
Open settings with the cog icon in the upper-right corner. If your experiments make the view harder to read, Restore default settings is in the upper-right corner of the settings box.
Global vs Local Graph
These are two scopes on the same linked notes, not competing systems. Global gives you an overview; local gives you context around the note you are working on.
| Question | Global graph | Local graph |
|---|---|---|
| What does it show? | The whole vault, subject to filters and exclusions | Notes connected to the active note |
| How do you open it? | Open graph view in the Ribbon | Open local graph command |
| Which settings are available? | Filters, Groups, Display and Forces | The same settings, plus depth |
| What is a useful task? | Review disconnected notes, hubs and broad clusters | Follow connections while researching or writing |
| What can make it overwhelming? | Showing too much of the vault at once | Expanding too many levels of connections |
The local depth slider sits at the top of the local graph’s Filter Settings panel. Each additional level reveals notes connected to the previous level. Start with direct neighbors, then expand only when you want to follow a connection further.
Imagine a recipe linked to an ingredient note. Expanding the neighborhood can reveal other recipes linked to that ingredient. The same pattern works for a project linked to a technical concept that other projects also reference.
Obsidian Graph View Settings, Explained
Configure the graph in this order: decide what belongs in the view, add meaningful colors, then adjust readability. Moving sliders before reducing the scope can leave you with a better-spaced version of the same clutter.
Filters: choose what appears
The Filters section controls which nodes are visible:
- Search files: filter notes using a search term. Try a term such as
cachingto narrow an investigation. - Tags: show or hide tags in the graph.
- Attachments: show or hide attachments.
- Existing files only: limit the graph to notes that actually exist. Obsidian allows links to notes you have not created yet.
- Orphans: show or hide notes without links.
Files matching your Excluded files patterns do not appear in Graph view. Remember this when a note seems inexplicably absent: the cause may be an exclusion rather than its links.
For a focused reading session, try hiding tags and attachments and enabling Existing files only. For a maintenance session, keep Orphans visible so disconnected notes remain available to inspect.
Groups: color notes with search queries
Obsidian graph view groups distinguish matching notes by color. Each group uses a search term to select its notes.
- Open Groups in graph settings.
- Click New group.
- Enter a search term for the notes you want in that group.
- Click the colored circle and choose a color.
For a technical vault, you might start with separate groups for caching, authentication and deployment. Use terms that already distinguish your notes; a broad term that matches nearly everything will not give you much visual separation.
Filters remove; groups color. A group helps you recognize matching notes among other visible notes. It does not create links or turn those notes into a new hierarchy.
Both Search files and Groups support Obsidian’s search terms. The official graph documentation points to the Search reference for advanced query syntax.
Display: make nodes and links readable
- Arrows: show the direction of links.
- Text fade threshold: control the transparency of note-name text.
- Node size: adjust the circles’ size.
- Link thickness: adjust the width of link lines.
- Animate: start a time-lapse in which notes and attachments appear in creation-time order.
Turn on Arrows when you need to distinguish a note linking outward from another note referencing it. Adjust Text fade threshold when labels are difficult to read, and reduce Node size or Link thickness if circles and lines dominate the view.
Animate shows the order in which files were created. Treat it as a history of additions, not a measure of how much your understanding improved.
Forces: adjust spacing, not meaning
These controls change the layout:
- Center force: controls compactness; a higher value creates a more circular graph.
- Repel force: controls how strongly nodes push one another away.
- Link force: controls the pull along links—think of tightening or loosening a rubber band.
- Link distance: controls line length between notes.
Change one control at a time. Try increasing Repel force when nodes overlap, then adjust Link distance if you need more space along connections. Return to the defaults if the result becomes harder to follow.
What the Graph Is Actually Good For
Give each graph session a question. “What have I failed to connect?” is actionable. “What does my second brain look like?” usually ends with a screenshot.
Find orphans worth integrating
Keep Orphans visible in the global graph and inspect disconnected notes. Ask whether each belongs with an existing project, concept or index note. Add a link where it helps future retrieval—not merely to eliminate an isolated circle.
A standalone note is not automatically a problem. A temporary capture or self-contained reference may need no links. The graph supplies candidates for review, not a cleanup mandate.
Inspect hubs and clusters
A large node receives references from more nodes. Open it and ask what role it plays: useful overview, frequently reused source or broad index? Size indicates linking activity, not quality.
Use clusters as starting points for inspection. Which ideas connect repeatedly? Is a draft connected to the sources it needs? In her account of using Obsidian’s graph, Eleanor Konik describes reviewing orphans, source usefulness and how developed article ideas appear from their connections. That is a workflow-specific interpretation, not a universal readiness score.
Follow a path between notes
Suppose “API latency” links to “Caching,” which links to “Cache invalidation.” Use the local graph to inspect the first connection, expand depth to expose the next, and open the intermediate note to understand why it connects them.
This is a manual way to trace a route through existing links. Keep the question concrete: “How does this project connect to that design decision?” The intermediate note may be more useful than either endpoint.
Know when to leave the graph
The graph is not a substitute for reading, an automatic similarity engine or a quality score for your knowledge base. If you already know the phrase you need, search directly. If you need to explain an argument to someone else, write the explanation rather than expecting the network picture to carry it.
For the underlying model of nodes and relationships, see our explanation of what a knowledge graph is.
Fix a Hairball Before Adding More Styling
When everything seems connected to everything, reduce the scope before changing the layout:
- Switch to the local graph. Open a note relevant to the task and start with a shallow depth.
- Hide attachments and tags. Bring them back only if they help answer your question.
- Enable Existing files only. This removes uncreated link targets from the view.
- Narrow Search files. Focus on a subject instead of the entire vault.
- Add a few color groups. Make categories distinguishable without giving every category its own visual treatment.
- Adjust Display and Forces last. Refine the smaller view rather than trying to spread out everything.
If the opposite happens and the graph looks empty, work backward: clear the search term, inspect Excluded files, show Orphans and reconsider the local depth. Missing attachments or tags may simply have their toggles disabled.
The stopping point is practical: can you identify the relevant notes and follow their links? Once you can, return to the work those notes support.
Plugins for Different Graph Workflows
You do not need a community plugin for the settings above. Add one when you can name a missing workflow, rather than because the global graph feels busy.
- ExcaliBrain: an alternative graph option discussed in the Obsidian community’s graph-use discussion. It also requires Excalidraw.
- Juggl: described in Konik’s article as a more feature-rich graph plugin with hierarchy functionality.
- Breadcrumbs: also discussed there for its visualization and adjacency-matrix options.
Those are different directions, not a ranking. First try the built-in local graph with a deliberate depth and filter. If that answers your question, another visualization may add configuration rather than value.
Coming from Notion?
Notion has no built-in graph view. IVGraph provides a Notion counterpart: pages become nodes, while backlinks, mentions and database relations become links in an interactive 3D graph. At the time of writing, it is free up to 500 nodes.
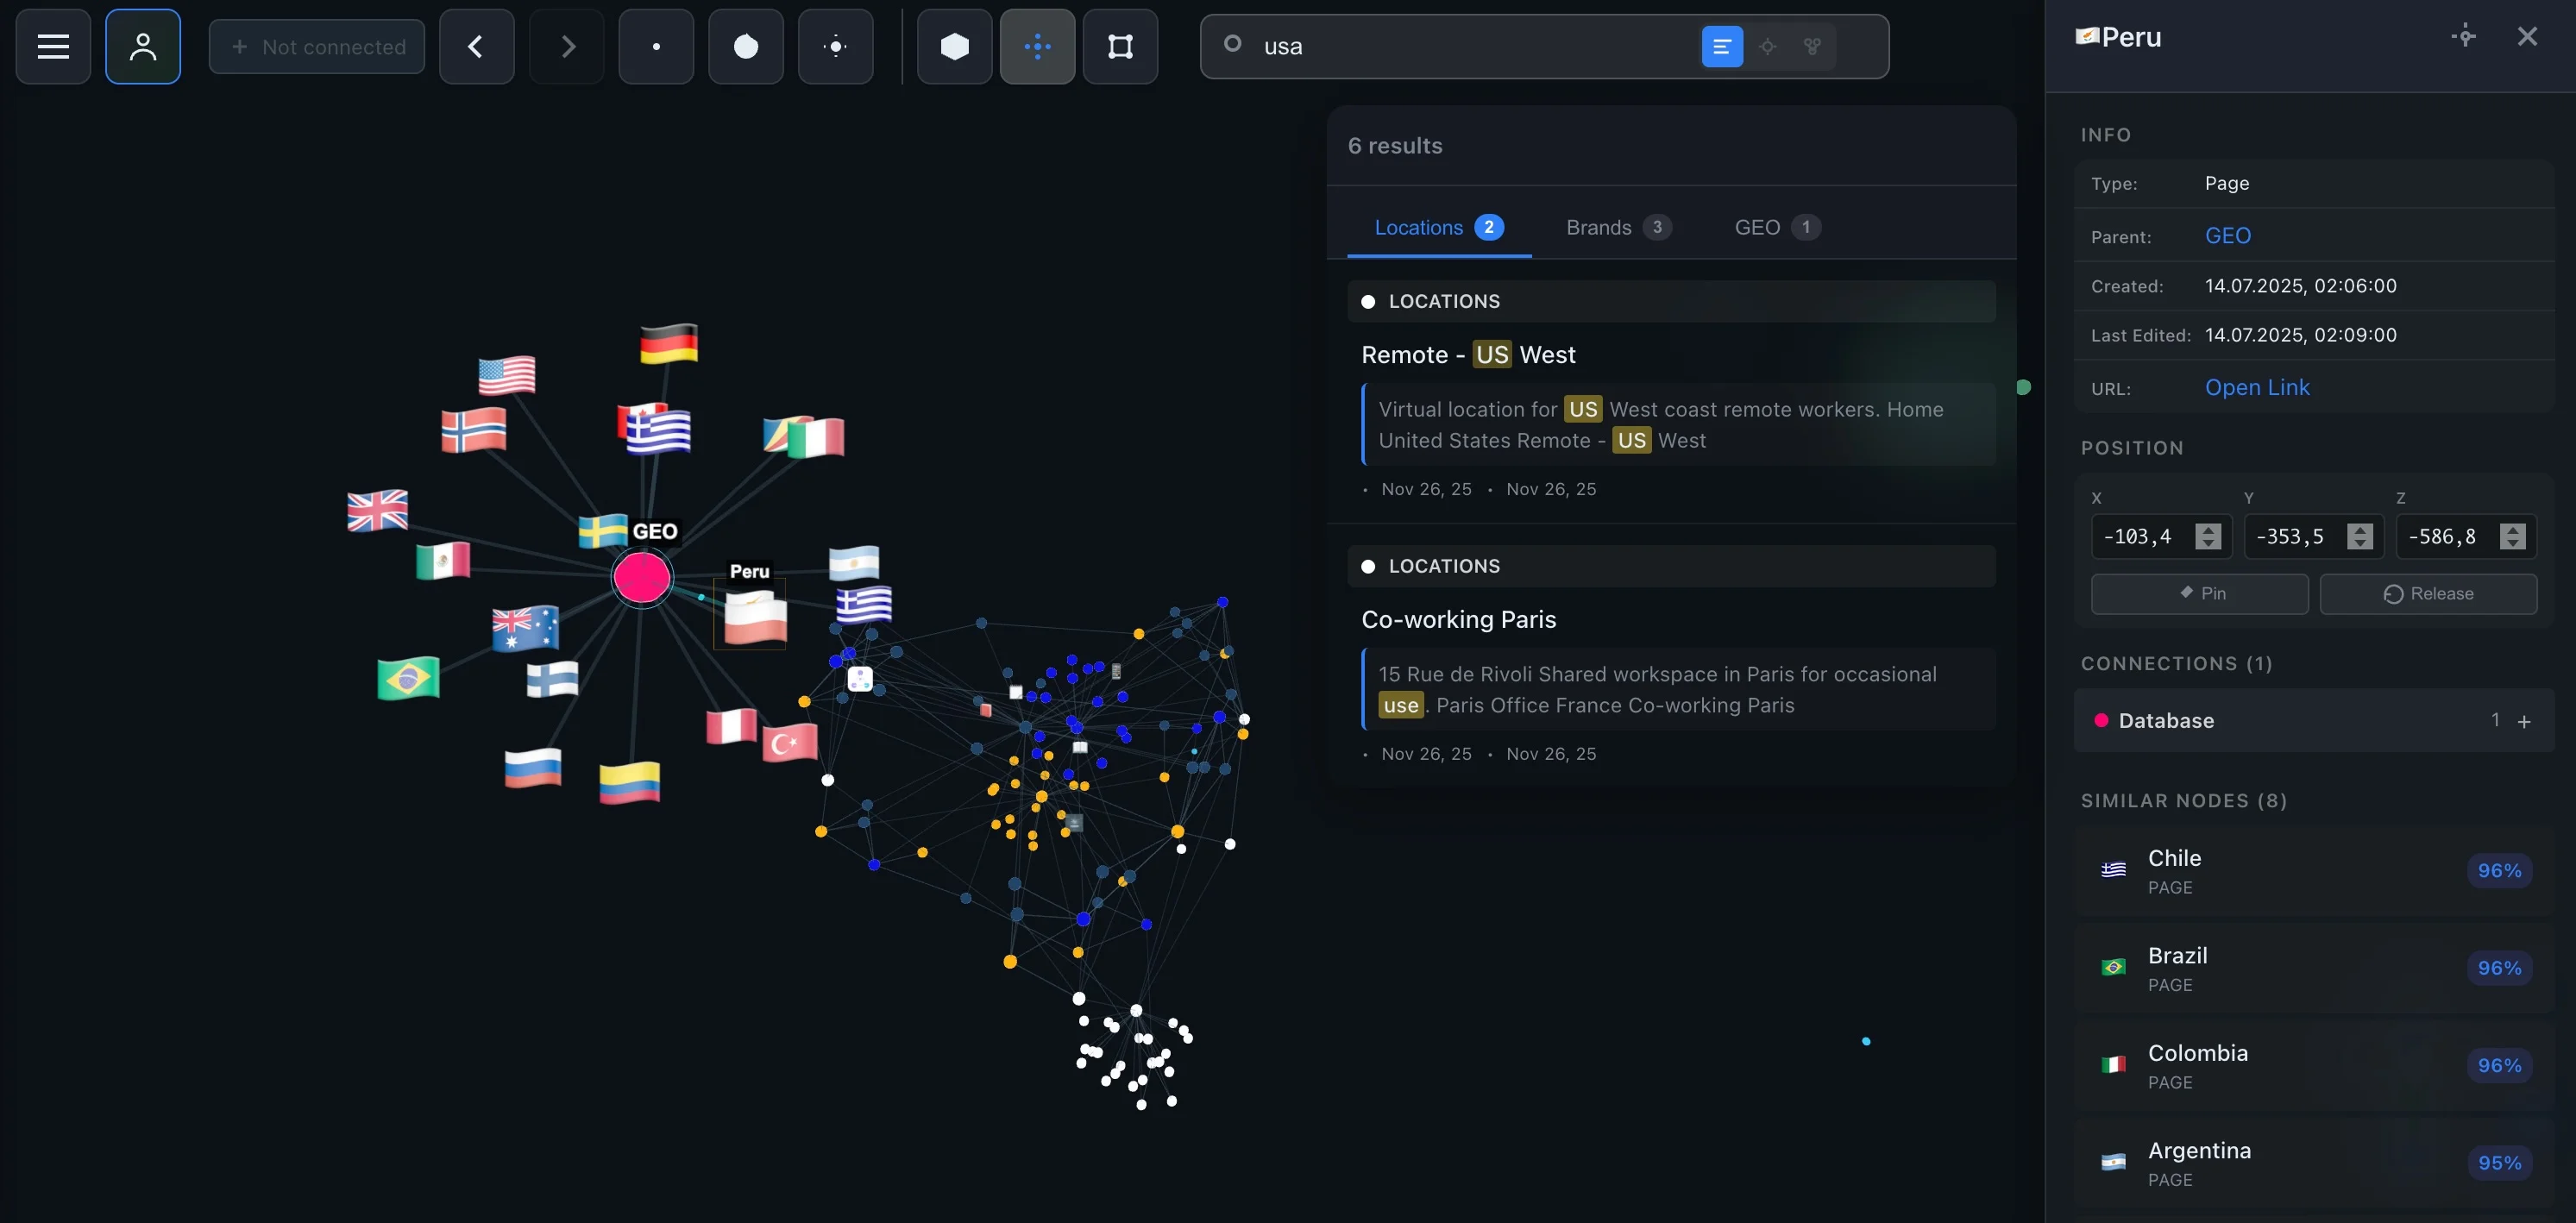
The same reading discipline applies: inspect actual connections, open the pages behind interesting nodes and avoid treating visual proximity as meaning. If your pages are barely linked, improving the links is more useful than adjusting the picture.
Our guide to Notion backlinks covers that linking foundation. For the visualization question specifically, see Notion’s graph-view options; for the broader choice of workspace, read Notion vs Obsidian.
FAQ
How do I open Obsidian’s graph view?
Click Open graph view in the Ribbon for the global graph. For the active note’s neighborhood, use the Open local graph command. Open settings with the cog icon in the graph’s upper-right corner.
What is the difference between global and local graph?
The global graph shows the vault’s network, subject to filters and exclusions. The local graph shows connections around the active note and adds a depth slider for expanding through successive levels of connected notes.
How do I change node colors in Obsidian?
Open graph settings, go to Groups and click New group. Enter a search term that matches the notes you want to color, then click the colored circle to choose their color. Groups color matching notes; Filters control which notes appear.
Why are notes missing from my graph?
Inspect Search files, the Orphans toggle and Excluded files patterns. In a local graph, the active note and depth also limit what appears. Existing files only hides linked targets that have not been created, while Tags and Attachments control those node types.
Can I get a graph view for Notion?
Notion has no built-in graph view. IVGraph renders Notion pages as nodes and backlinks, mentions and database relations as links in an interactive 3D graph. At the time of writing, it is free up to 500 nodes.